Understanding how your automations perform should be effortless, and the statistics experience should match the power of the workflows you build. With the latest Automation release, we've completely redesigned workflow statistics from the ground up, delivering a richer, more intuitive experience that keeps performance data front and center on the canvas. New visualization options, flexible time ranges, and deeper per-node insights make it easier than ever to monitor, validate, and optimize every step of your workflow in real time.
We've completely rebuilt the statistics experience inside Automation with a set of capabilities designed to keep you informed without breaking your flow.
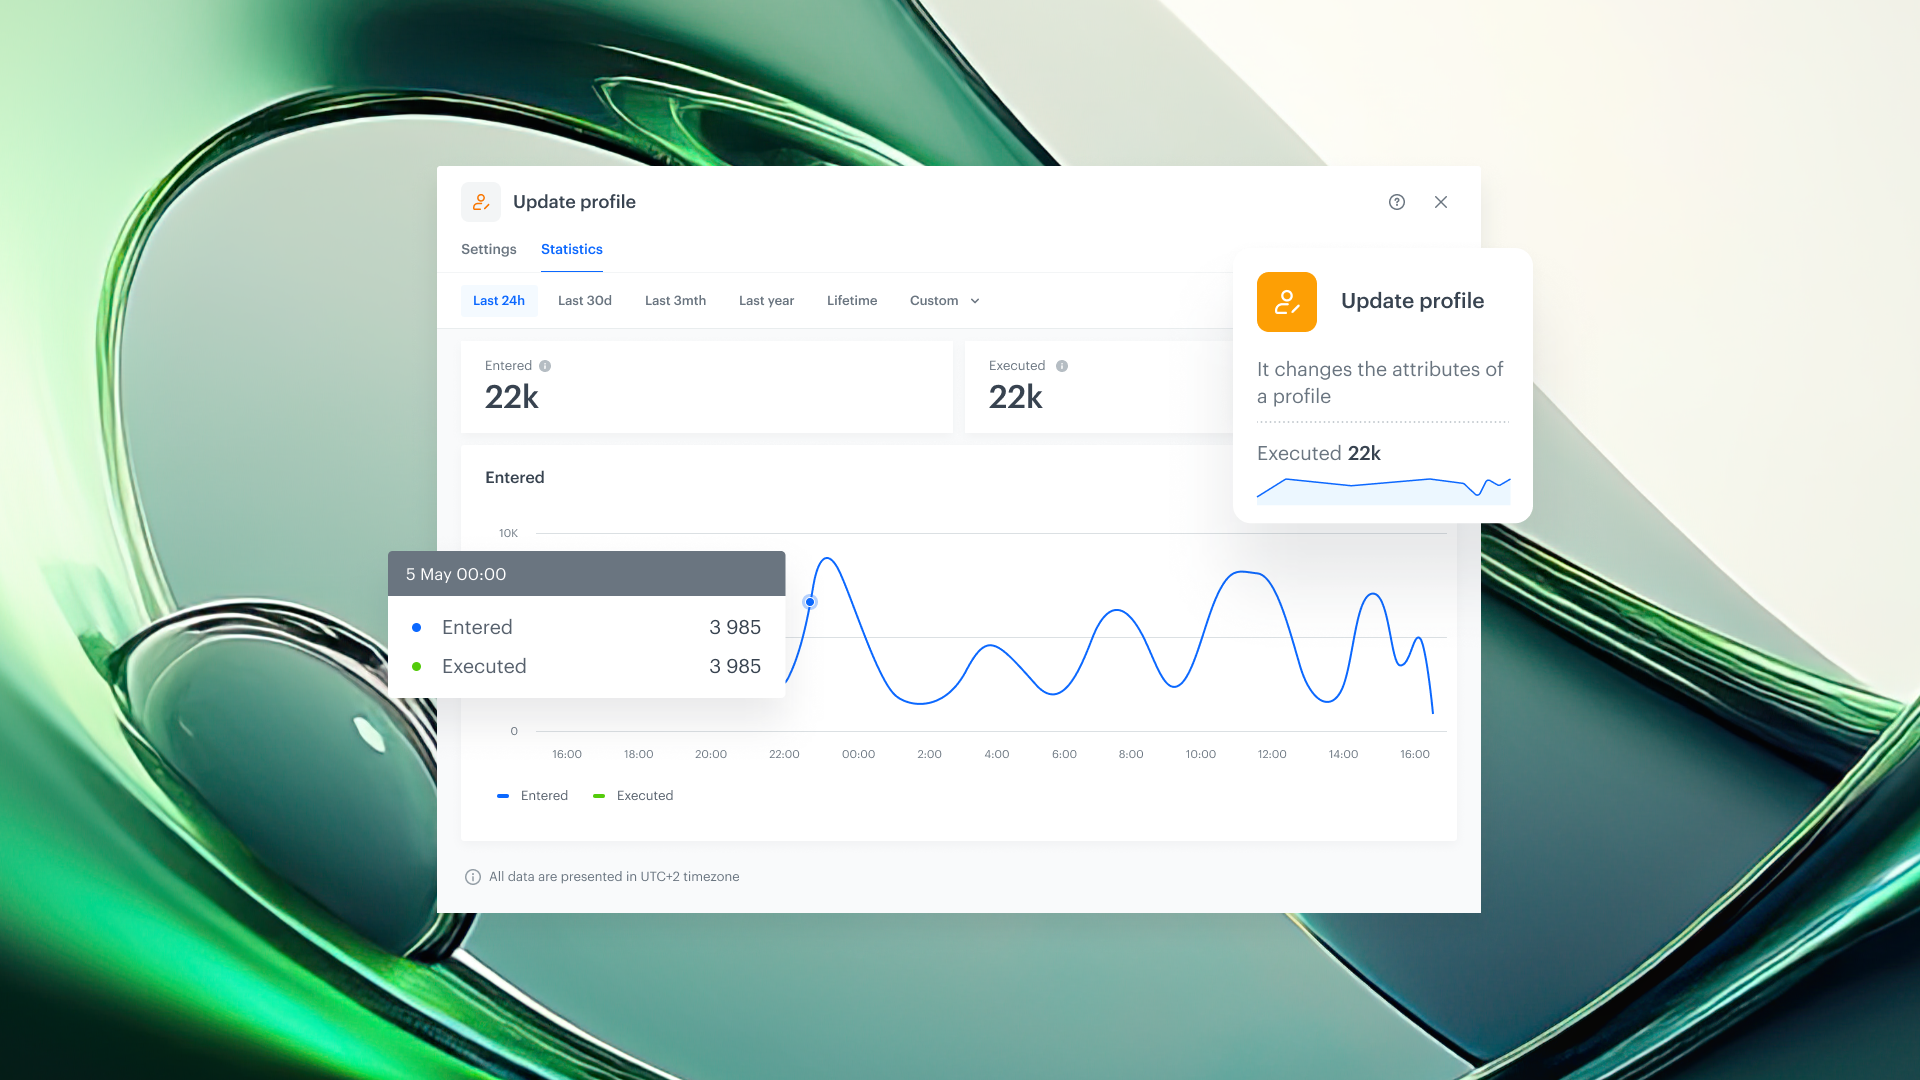
1. Faster decision-making
When performance data lives directly on the canvas, you don't need to hop between tools or wait for reports. You see the current state of your workflow the moment you open it, and you can act immediately.
2. Proactive monitoring
The heartbeat and timeline views make it easy to catch irregularities before they become problems. Spot a sudden drop in executions, investigate a spike in send failures, or validate that a newly deployed workflow is performing as expected, all in real time.
3. Built to grow
The new statistics architecture isn't just a visual refresh, it's a foundation. Expect new metrics, deeper drill-downs, and expanded monitoring capabilities in future releases, all built on this solid base.
Understanding how your automations perform should be effortless, and the statistics experience should match the power of the workflows you build. With the latest Automation release, we've completely redesigned workflow statistics from the ground up, delivering a richer, more intuitive experience that keeps performance data front and center on the canvas. New visualization options, flexible time ranges, and deeper per-node insights make it easier than ever to monitor, validate, and optimize every step of your workflow in real time.
We've completely rebuilt the statistics experience inside Automation with a set of capabilities designed to keep you informed without breaking your flow.
1. Faster decision-making
When performance data lives directly on the canvas, you don't need to hop between tools or wait for reports. You see the current state of your workflow the moment you open it, and you can act immediately.
2. Proactive monitoring
The heartbeat and timeline views make it easy to catch irregularities before they become problems. Spot a sudden drop in executions, investigate a spike in send failures, or validate that a newly deployed workflow is performing as expected, all in real time.
3. Built to grow
The new statistics architecture isn't just a visual refresh, it's a foundation. Expect new metrics, deeper drill-downs, and expanded monitoring capabilities in future releases, all built on this solid base.


